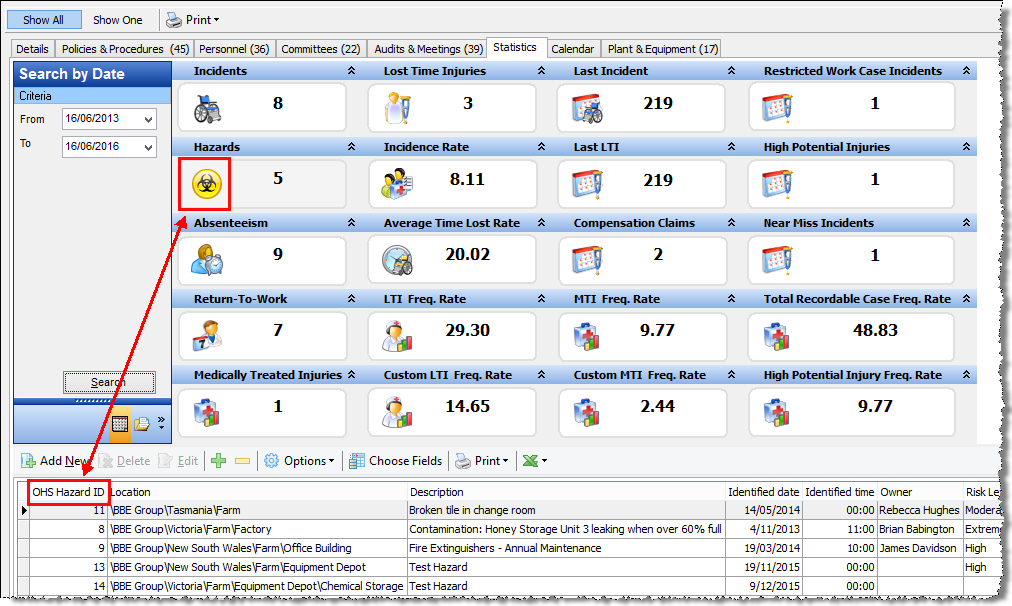
Locations - Statistics

This tab displays a range of statistical information in categories.


Each category contains an icon and a number which will show, for example, how many hazards or incidents have occurred. This number will vary depending on the dates you have specified in the Date Period search, the location you are currently viewing, and whether you have the Show All or Show One option selected.

Note that if you rest your cursor over any one of the categories, a hint is displayed.

Some categories will have associated information. Click on the icon for that category to display the list of information in the bottom section of the window.


Entries for these categories are either added or edited via the associated node in the OH&S tree structure (e.g. Hazards or Incidents), or they are the results of calculations based on input information.

Select Pay Items

When you click the icons for Absenteeism, Incidence Rate, LTI/ MTI Frequency Rate, this will first display a ‘select Pay Items’ window. By selecting the Pay Items you want to include, this will adjust the associated calculations accordingly. If you tick the ‘Do not show this window again’ option, this will retain the Pay Items selection you have specified, and a ‘Pay Items’ link is added to the options, so that you can reopen the ‘select Pay Items’ window if necessary.

Statistic Types:

 
Incidents Lost Time Injuries [LTI] Last Incident
  • This displays how many incidents have occurred within the Date Period specified.
  • Selecting the icon displays the Incidents list in the lower half of the screen. Selecting an entry will display the Incidents window.
  • This displays how many of the incidents led to time off work within the date period specified.
  • Selecting the icon displays the Incidents list in the lower half of the screen. Selecting an entry will display the Incidents window.
  • For LTI Statistics to be generated: System Preferences | Settings | OHS – in AS1885 Incident Classification select ’01 Lost time injury/disease’.
  • This displays how many days it has been since the last incident occurred.
  • Selecting the icon displays the Incidents list in the lower half of the screen. Selecting the last incident entry displays the Incidents window.
Hazards Incidence Rate Last LTI
  • This displays how many hazards have been registered within the Date Period specified.
  • Selecting the icon displays the Hazards list in the lower half of the screen. Selecting an entry will display the Hazards window.
  • This is the number of occurrences of injury/disease for each hundred workers employed in the period.
  • Selecting the icon (and pay item/s) displays the Incidents list in the lower half of the screen. Selecting an entry will display the Incidents window.
  • This displays how many days it has been since the last Lost Time Incident occurred.
  • Selecting the icon displays the Incidents list in the lower half of the screen. Selecting the last incident entry displays the Incidents window.
Absenteeism Average Time Lost Rate Compensation Claims
  • This lists occurrences of personnel being away from work during the time period specified.
  • The list can be filtered by pay items – click the icon then select the required pay items.
  • Note that you cannot open the entries displayed.
  • This looks at the average time (days) lost per occurrence of injury/disease (as per AS1885).
  • The time is obtained from the Lost Time field via Incident | Action and is cumulative (i.e. multiple actions, with hours entered in this field, will be combined).
  • This displays the total number of incidences with compensation claims, during the date period specified.
  • Selecting the icon displays a list of associated Incidents in the lower half of the screen. Selecting an entry will display the Incidents window.
Return-To-Work LTI Frequency Rate MTI Frequency Rate
  • This displays how many Return to Work actions have been entered against an incident.
  • This data is compiled when ‘Return to Work’ is entered as the Action Type via Incident | Action.*
  • This is the number of occurrences of Lost Time Injuries for each one million hours worked.
  • For LTI Statistics to be generated: System Preferences | Settings | OHS – in AS1885 Incident Classification select ’01 Lost time injury/disease’.
  • This is the number of occurrences of Medically Treated Injuries for each one million hours worked.
  • For MTI Statistics to be generated: System Preferences | Settings | OHS | MTI Incidents are identified by | Incident Type. Select the appropriate Type, as created in Validation Tables, or choose Add New.

The calculations for Incidence Rate, Average Time Lost Rate, and LTI Frequency Rate, are all described in Statistics Calculations.

* Note that Action Type ‘Return to Work’ should only be used when an employee returns to work following an incident involving a compensation claim.

Medically Treated Injuries Custom LTI Frequency Rate Custom MTI Frequency Rate
  • You may change the hours worked value from one million hours (for the Standard LTIFR) to whatever value is more appropriate for your company.
  • Go to System Preferences | Settings | OHS and specify the new value in Custom LTIFR Hours.
  • You may change the hours worked value from one million hours (for the Standard MTIFR) to whatever value is more appropriate for your company.
  • Go to System Preferences | Settings | OHS and specify the new value in Custom MTIFR Hours.


The following Statistics Types are recent additions to OHS:

Restricted Work Case Incidents High Potential Injuries Near Miss Incidents Total Recordable Case Freq. Rate High Potential Injury Freq. Rate
  • Where the 'Injury Type' has been specified as a Restricted Work Case, this displays the total number of these injuries that have occurred during the date period specified.
  • Selecting the icon displays a list of associated Restricted Work Case in the lower half of the screen. Selecting an entry will display the Restricted Work Case window
  • For these statistics to be generated: System Preferences | Settings | OHS – specify the Incident Type you require for RWC Incidents.
  • Where the 'Injury Type' has been specified as a High Potential Injury, this displays the total number of these injuries that have occurred during the date period specified.
  • Selecting the icon displays a list of associated High Potential Injuries in the lower half of the screen. Selecting an entry will display the High Potential Injuries window
  • For these statistics to be generated: System Preferences | Settings | OHS – specify the Incident Type you require for HPI Incidents.
  • This displays the total number of Near Miss incidences that have occurred during the date period specified.
  • Selecting the icon displays a list of associated Near Miss Incidents in the lower half of the screen. Selecting an entry will display the Near Miss Incidents window
  • For these statistics to be generated: System Preferences | Settings | OHS – in AS1885 Incident Classification select ’03 Near Miss'
  • This is the number of occurrences of Recordable Cases for each one million hours worked.
  • This is the number of occurrences of High Potential Injuries for each one million hours worked.


More information:

Incidents Overview

Hazards Overview

Statistics Calculations and Examples

Back to Locations Overview